
Forecasting and Planning
When the implementation of all the tags is complete (see Adhese setup and implementation), they start measuring and collecting data for each position of the inventory (see Measure). These figures give you an overview of the daily inventory volume available to you. This practice is called forecasting and allows you to manage your daily inventory.
Inventory / forecasting
The Adhese interface has a clear forecast overview: Inventory. The inventory forecasting tool provides all the data needed to plan campaigns with a high degree of accuracy.
Running a forecast report
To forecast your inventory (positions and channels):
- Go to the Inventory screen. Click Inventory in the left navigation menu of Adhese.
- Search for a position or select a position by choosing a publication, location and format.
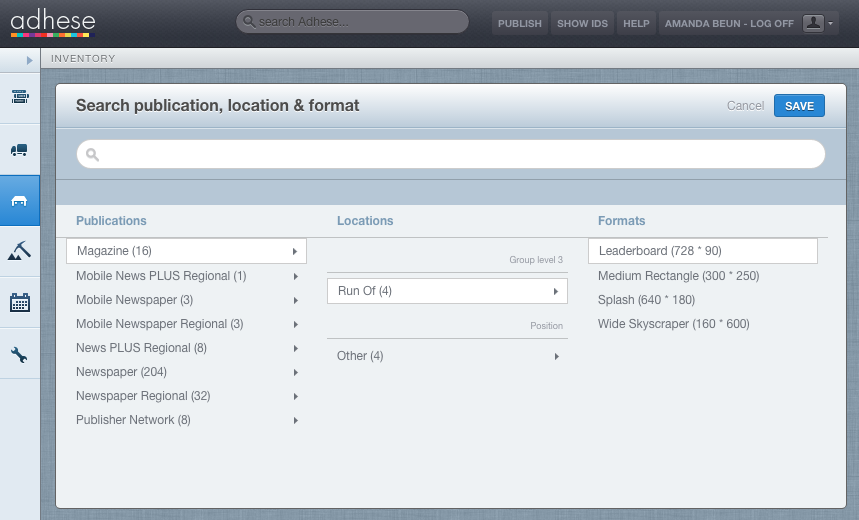
- Click the Save button. By default, the forecast report shows the last 30 days (impressions already delivered) and the next 30 days (expected volume). By changing the time of a forecast report, you can gain insight into both historical and forecasted volumes of inventory.


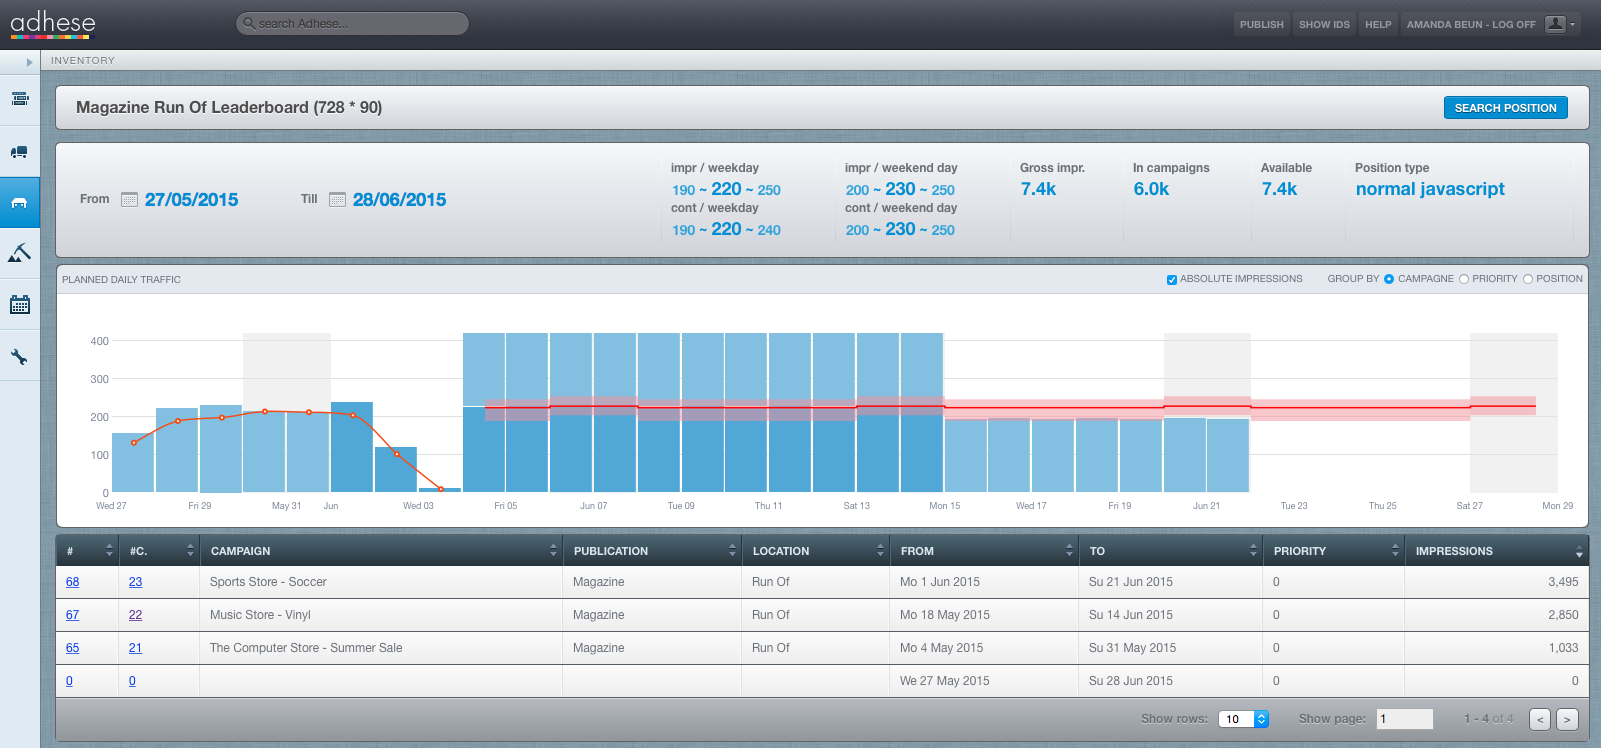
Overview of the forecasting report
In the forecast report you will find:
- a summary of important forecasting figures
- the planned daily traffic bar chart
- an overview of future bookings
The forecast report shows the following figures for the selected position or channel and period (using past performance data):
- The number of daily impressions, from Monday to Friday (position average);
- The number of unique daily visitors, from Monday to Friday (position average);
- The number of daily impressions in the weekend (position average);
- The number of unique daily visitors in the weekend (position average);
- The number of gross impressions or the volume of available impressions that you can book during the selected period;
- The number of booked impressions;
- The number of available impressions. This metric is equal to the number of gross impressions minus the number of booked impressions.
Example:
The inventory shows [180 - 240k - 340] impressions on a weekday.
This interval represents the range of total daily impressions that the selected position can achieve with 95% certainty. The middle number is the median. Adhese can predict with 95% certainty that more than 180,000 and less than 340,000 impressions will be delivered; the median of the last 30 days was 240,000 impressions.
The estimated figures are available for the complete network, including clusters of positions such as run of site, run of network, and custom channels, as well as creative templates like main and sub formats. Some of the above figures are also available in the individual Booking overview. For more information, refer to Forecasting figures and Position averages.
Alongside these figures, the forecast report shows the planned daily traffic graph. Each bar represents the daily volume of booked impressions for the position and compares it with its expected daily traffic. The position averages indicate the expected daily traffic. The expected volume range for the position is highlighted in red. A dark red curve indicates the median.
If the height of the bar chart exceeds the curve, the position is overbooked. This happens when the number of impressions booked is greater than the number of impressions available.
The daily volume of each individual booking is displayed as a percentage or absolute impressions within a single bar. Bookings with a higher priority will appear lower in the bar. The bookings can be grouped by campaign or ordered by priority level.
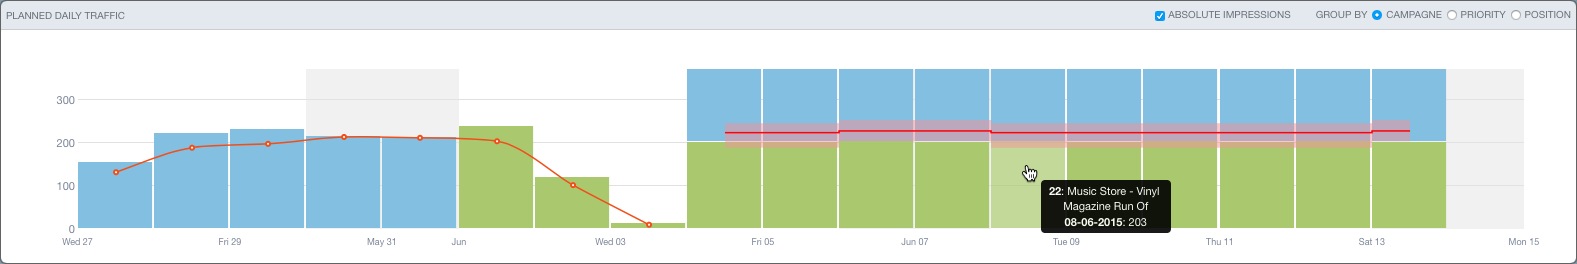
When hovering over the bar chart, the graph highlights each individual booking and shows the booking's delivered or expected volume of daily impressions.
Below the planned daily traffic bar chart, there is a list or table that displays all future bookings. Clicking on any of these bookings will change the booked impressions to orange in the bar chart. This provides an indication of whether the scheduled impressions will be delivered - before the campaign even starts running.
The Inventory tool enables you to modify or select a different period, allowing you to monitor daily traffic and compare delivery to that of competitive bookings. A red curve indicates the daily traffic for the position, while each bar represents the daily volume of delivered impressions. Hovering over the bar chart highlights each individual booking at the selected position and shows the volume of daily impressions delivered by the booking.
Please note that you can not add up unique visitors. The number of unique visitors of a channel position is not equal to the sum of unique visitors of all the individual positions of that channel.
Planning
To plan and predict future availability, Adhese has a second screen called Planning.
Running a planning report
To run a planning report:
- Go to the Planning screen. Click Planning in the left navigation menu of Adhese.
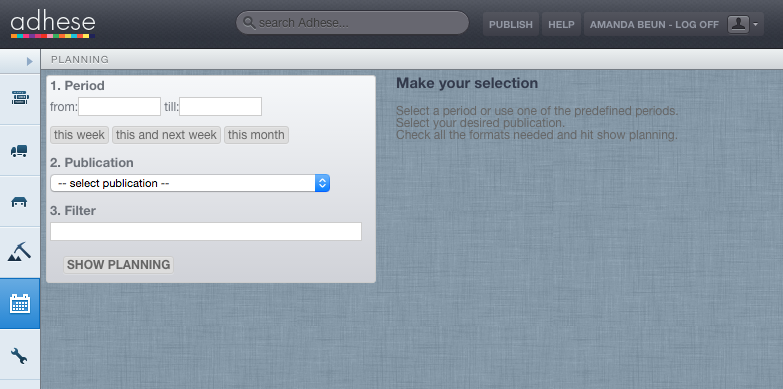
- Select a period. Choose a start (from) and end date (till) or pick one of the predefined periods.
- Select the desired publication from the Publication drop-down.
- The available formats for the selected publication will be displayed in a list. Select the required formats.
- Click the Show planning button. This shows the planning for the selected period, publication, and format(s). If needed, use the Filter field above the planning matrix to refine your request.
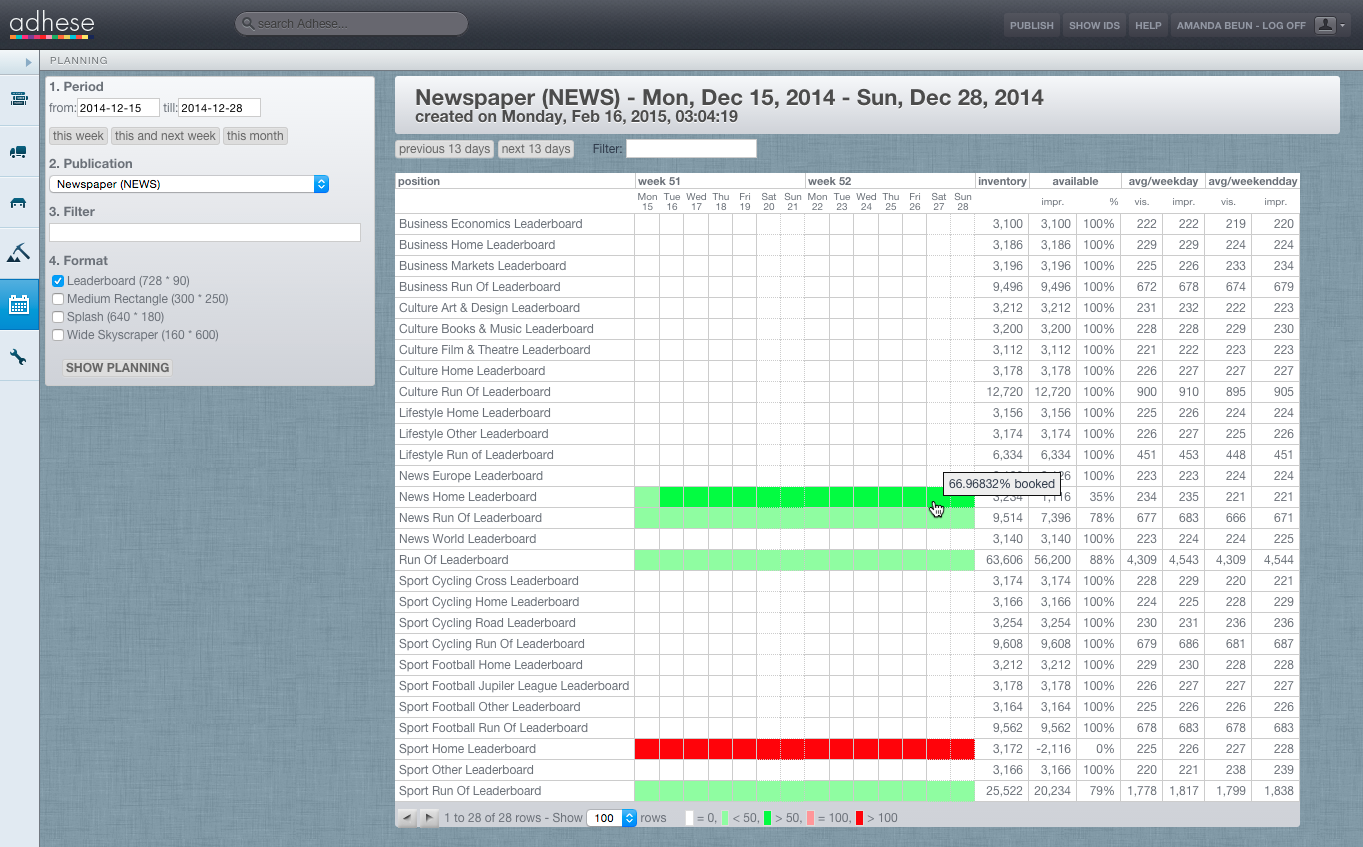


Overview of the planning report
The matrix shows the position's sold impressions instantly using colours:
- White: 100% available;
- Light green: more than 0% and less than 50% impressions are booked;
- Dark green: more than 49% and less than 100% impressions are booked;
- Pink: the position is fully booked (100%);
- Red: the position is overbooked (more than 100%).
When hovering over the matrix, a small tooltip displays the precise percentage of the position's daily booked impressions, which in the above screenshot is 66.97%.
The following figures for each position and the selected period are shown next to the matrix:
- The position's expected volume of inventory or impressions;
- The volume that is still available to be booked;
- The average number of unique visitors and impressions for a weekday and a weekend day.
When you click a cell in the Planning matrix, an overview appears:
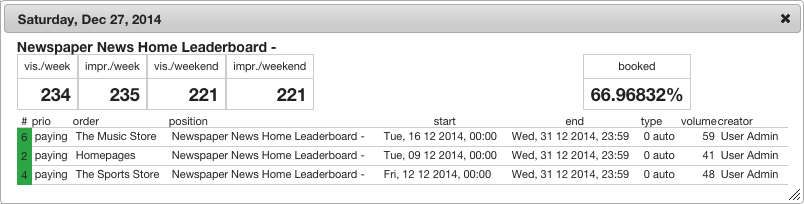
This overview presents the following information about the selected position:
- The average number of unique visitors and impressions for a weekday and a weekend day.
- The percentage booked indicates the number of booked impressions out of the available impressions on the selected day.
- A list that provides more information about the campaigns and bookings that are booked at the selected day:
- Campaign ID
- Campaign priority
- Campaign name
- Name of the position
- Start date and hour of the booking
- End date and hour of the booking
- Type of booking
- The volume of impressions that is booked for the selected day by the booking
- Creator of the campaign
If you click a booking on the list, the Campaign Header tab will open in a new browser tab.