
Built-in reporting: the Report tab
The Adhese interface enables users to view reports which can be used to measure the performance of their campaigns, bookings or creatives.
How to view a report?
To view a report about a campaign, booking or creative:
- Go to the Campaign overview. Click Campaigns in the left navigation menu of Adhese.
- Select a campaign from the Campaign overview.
- To view a campaign report,
- Click the Report tab. The campaign report opens by default.
- To view a booking report, do one of the following:
- Click the Report tab and select a booking from the drop-down.
- Click the Bookings tab, select a booking, and click the Report tab.
- To view a creative report, do one of the following:
- Click the Report tab and select a creative from the drop-down.
- Click the Creatives tab, select a creative, and click the Report tab.
- To view a campaign report,
What reports can you view?
Total results
Each report includes a general overview of the Total results. This overview presents some key results of the selected campaign, booking, or creative:

- Start and end date;
- Number of impressions;
- Number of clicks;
- Number of contacts;
- Click-through rate based on the number of impressions;
- Click-through rate based on the number of contacts.
Daily results
The Daily results table shows the daily performance metrics. To download the table as a spreadsheet, click the download as XLS link above the table.
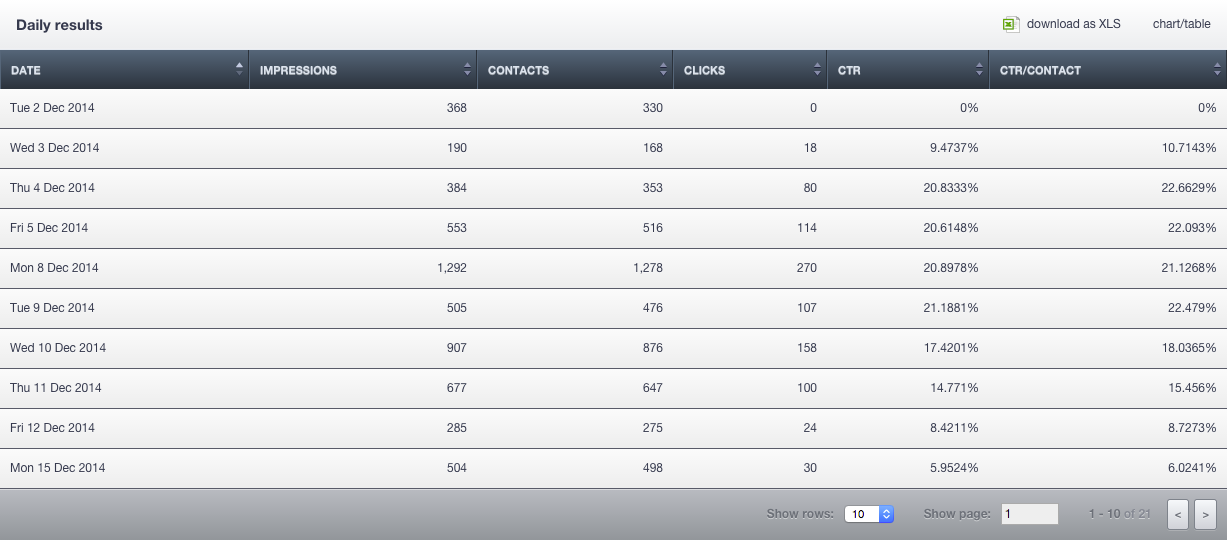
If you require a visual representation of the data, click the chart/table link above the table. The following paragraphs discuss each of the graphs in detail.
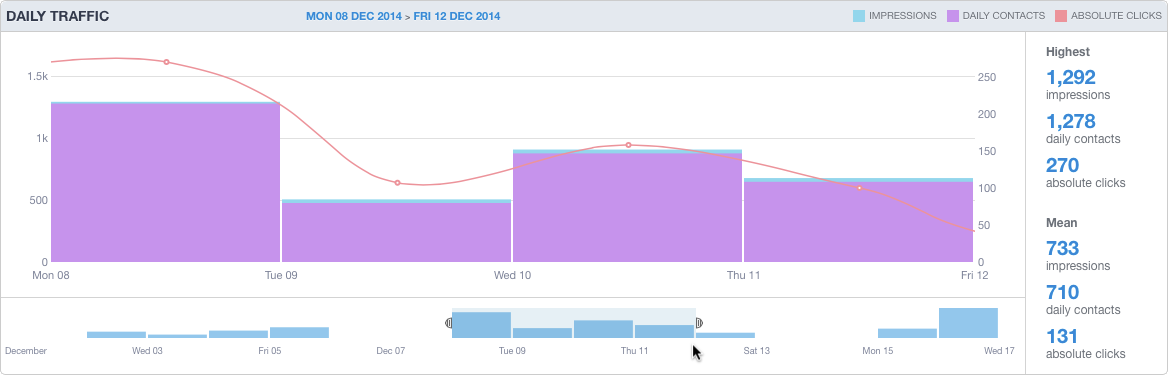
Daily traffic
The Daily traffic graph shows the number of daily impressions, contacts and absolute clicks for the selected campaign, booking or creative. The exact number of daily impressions, contacts, or clicks can be viewed by hovering over the bar chart.
Next to the graph, the highest number and the mean number of daily impressions, contacts and clicks are displayed.
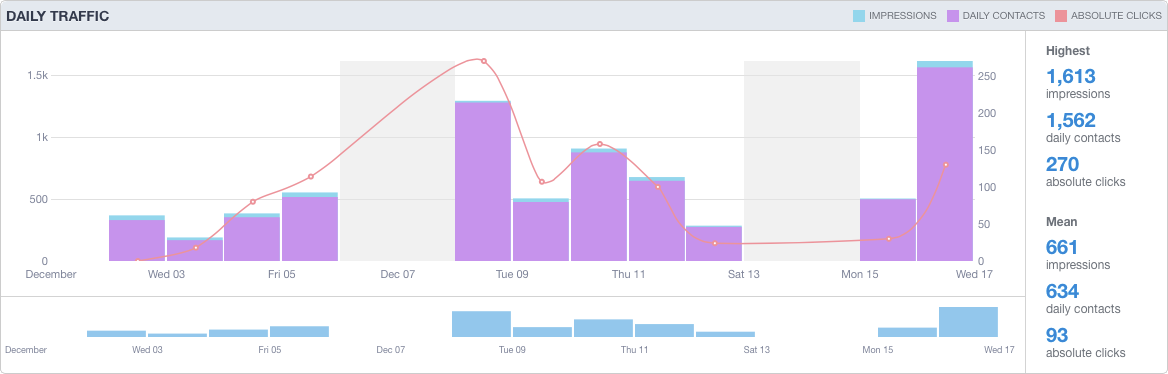
Beneath the daily traffic graph, you will find a time axis. If you wish to highlight a specific period on the chart, click the left mouse button and select the desired period. If the button is released, the graph will change according to the chosen period. The period can be modified by using the arrows located on the left and right sides of the time axis. The figures displayed alongside the graph will be updated to reflect the selected dates.
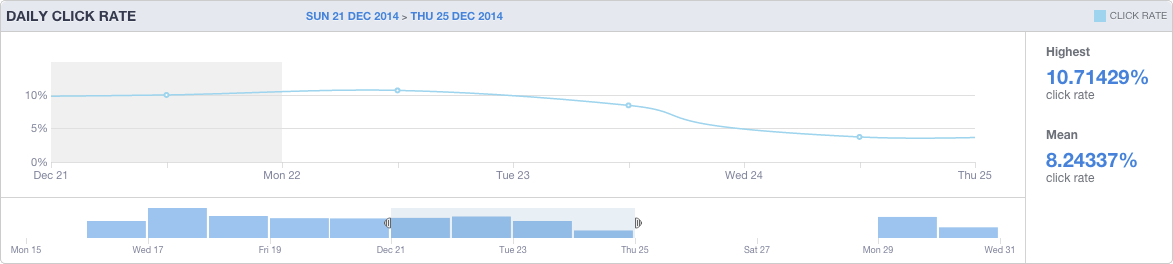
Daily click rate
The Daily click rate graph denotes the daily click-through rate (CTR) of the selected campaign, booking or creative. To display the exact CTR, hover over the line chart. The highest daily CTR and the mean CTR are displayed next to the graph.
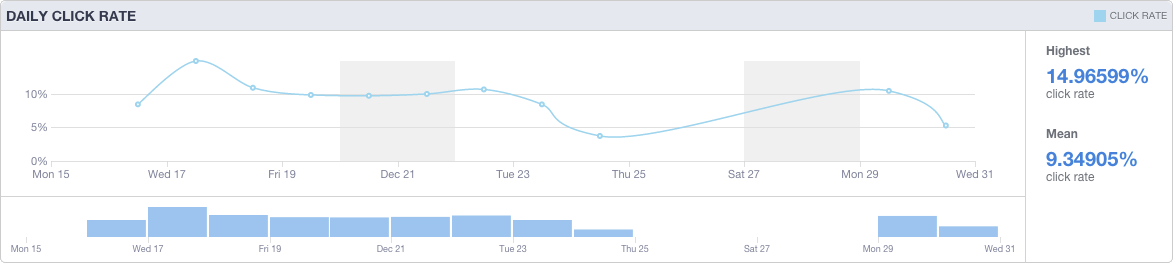
Beneath the graph, you will find a time axis. If you wish to highlight a specific period on the chart, click the left mouse button and select the desired period. If the button is released, the graph will change according to the chosen period. The period can be modified by using the arrows located on the left and right sides of the time axis. The figures displayed alongside the graph will be updated to reflect the selected dates.
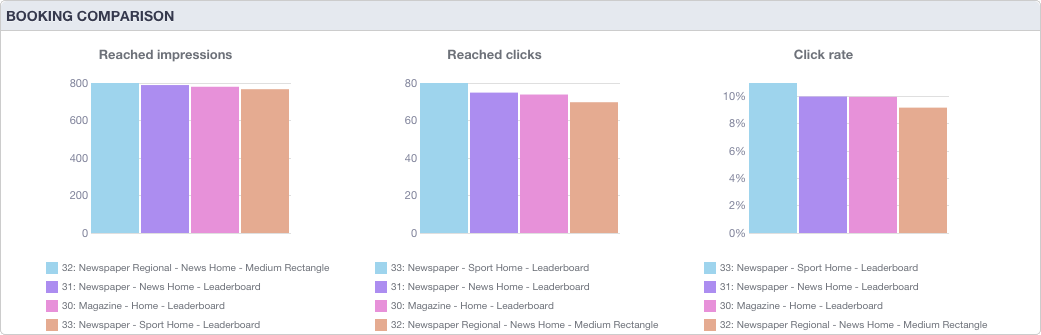
Booking comparison (Campaigns only)
The Booking comparison graph consists of three different bar charts in which the bookings of a campaign are compared with one another based on the following three variables:
- Reached impressions;
- Reached clicks;
- Click rate.
Every single bar represents a booking from the campaign.
Results per creative (Bookings only)
The Results per creative graph illustrates the results per creative of the selected booking. As a booking can be attached to several creatives, the results (impressions and click-through rate) are displayed for each creative assigned to the booking.
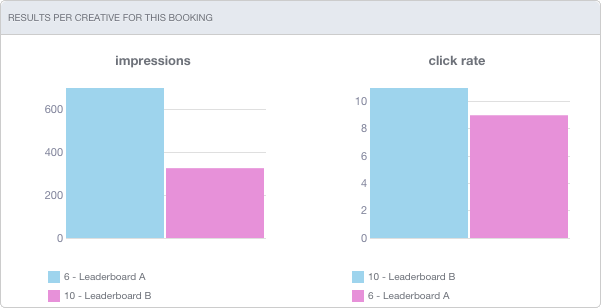
When hovering over a bar chart, a tooltip will display the absolute number of impressions or the click-through rate (as a percentage).
Results per booking (Creatives only)
The Results per booking graph illustrates the selected creative results per booking, given that a creative can be attached to multiple booked positions. Consequently, the results (in terms of impressions and click-through rates) are displayed for each booking to which the creative has been attached.
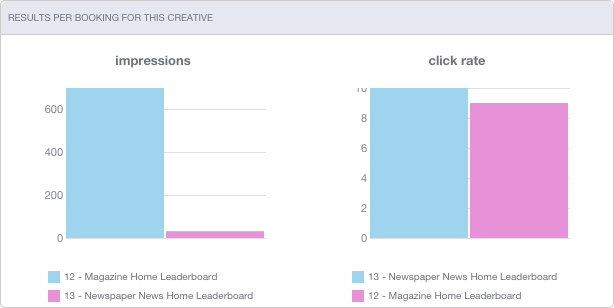
When hovering over a bar chart, a tooltip shows the absolute number of impressions or the clickthrough rate (as a percentage).
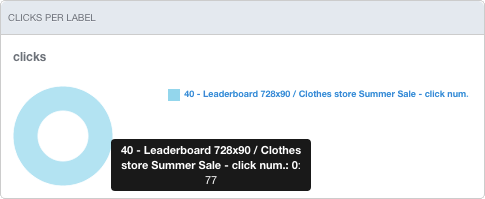
Clicks per label (Creatives only)
The Clicks per label doughnut chart shows separate results for every link in a creative, as a creative may contain several links to the same or different landing pages. This is useful for testing several calls to action within a creative.
Click rate benchmark
The Click rate benchmark graph compares the click-through rate of each selected campaign, booking or creative to the click-through rates of comparable campaigns, bookings on the same position or creatives that have the same format, respectively.
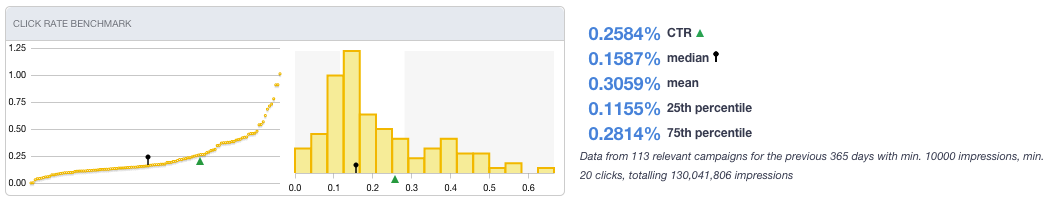
The first graph, a line graph, sorts all comparable campaigns, bookings, or creatives on the horizontal axis in ascending order based on the CTR.
A black dot with a stripe  represents the median. The median is always situated in the middle of the line graph because the horizontal axis represents the data set.
The green triangle  situates the selected campaign, booking, or creative. The further to the left this triangle is, the worse its performance is compared to other comparable campaigns, bookings, or creatives.
Some figures are shown next to the graph (figures on which the chart is based):
- The CTR of the selected campaign, booking, or creative
 .
. - The median
 . If the CTRs of all compared campaigns, bookings, or creatives are sorted in ascending order, what is the CTR of the middle campaign, booking, or creative?
 - The median CTR of all campaigns, bookings, or creatives.
- The 25th percentile or the first quartile: 25% of all campaigns, bookings, or creatives have a lower CTR or 75% of all campaigns, bookings, or creatives have a higher CTR.
- The 75th percentile or the third quartile: 75% of all campaigns, bookings, or creatives have a lower CTR or 25% of all campaigns, bookings, or creatives have a higher CTR.


Adhese also displays the number of campaigns, bookings, or creatives taken into account to create the graph.
eCPM benchmark
The eCPM benchmark graph compares the effective cost per thousand impressions (eCPM) of the selected campaign, booking, or creative to the eCPM of all other campaigns, booking on the same position, or creatives with the same format, respectively.
The eCPM, or effective cost per thousand impressions, is a metric that indicates the value of the advertising inventory if it were sold on a CPM basis.
A numerical example clarifies the eCPM. Assume the CPM of a booking is equal to €13,00 and the number of booked impressions to 160.000. Then, the price of the booking equals
13 * (160.000/1.000) = €2.080
If the booking has eventually generated a number of 172.757 impressions, the eCPM is equivalent to
2.080 / (172.757/1.000) = €12,04
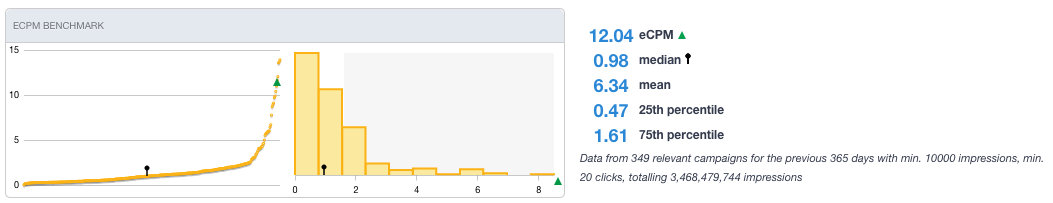
All comparable campaigns, bookings, or creatives are sorted in ascending order on the line graph's horizontal axis.
A black dot with a stripe  represents the median. The median is always situated in the middle of the line graph because the horizontal axis represents the data set.
The green triangle  situates the selected campaign, booking, or creative. The further to the left this triangle is, the worse its performance is compared to other comparable campaigns, bookings, or creatives.
Some figures are shown next to the graph (figures on which the chart is based):
- The eCPM of the selected campaign, booking, or creative
 .
. - The median
 . If the eCPMs of all compared campaigns, bookings, or creatives are sorted in ascending order, what is the eCPM of the middle campaign, booking, or creative?
 - The median eCPM of all campaigns, bookings, or creatives.
- The 25th percentile or the first quartile: 25% of all campaigns, bookings, or creatives have a lower eCPM, or 75% of all campaigns, bookings, or creatives have a higher eCPM.
- The 75th percentile or the third quartile: 75% of all campaigns, bookings, or creatives have a lower eCPM, or 25% of all campaigns, bookings, or creatives have a higher eCPM.


Adhese also displays the number of campaigns, bookings, or creatives taken into account to create the graph.
No comments to display
No comments to display