
Datamine
Data mining is a process that transforms raw data into easily digestible information, allowing users to identify patterns and profiles.
Several data mining reports are available via the Datamine tab of the Adhese interface. These reports are exported to a file that can be read in Excel.
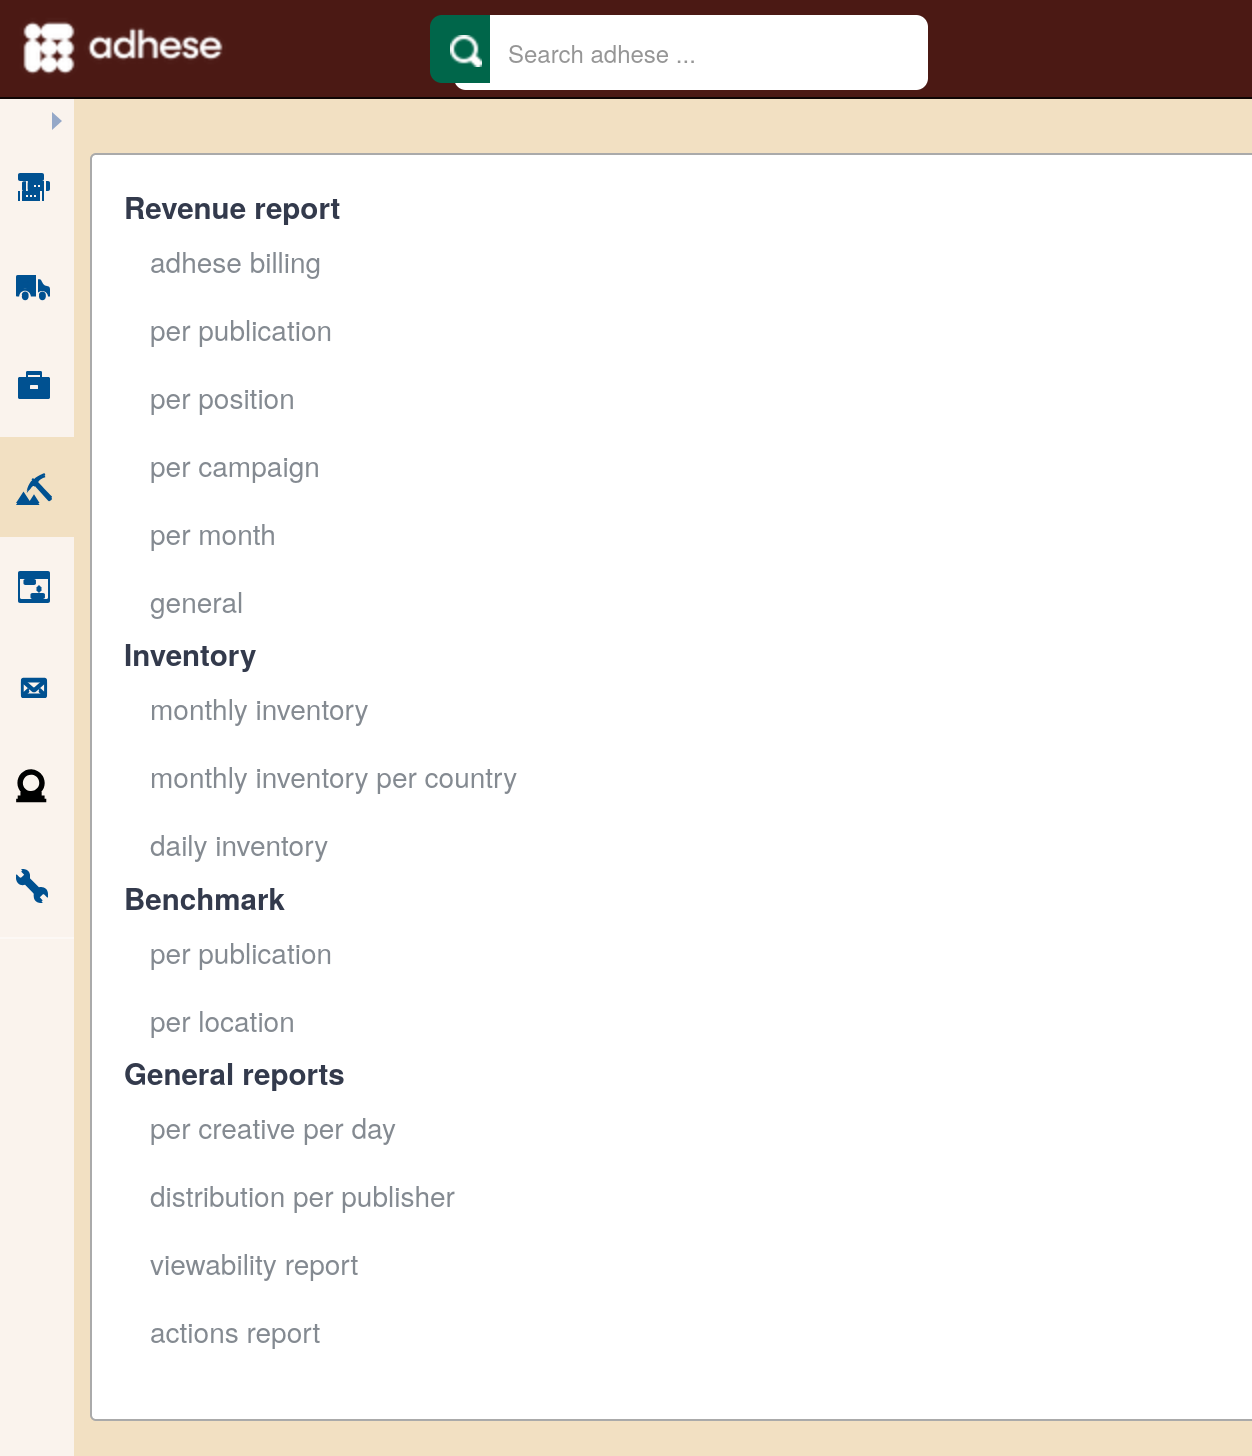
To generate a data mining report, click Datamine in the left navigation menu. The Datamine screen opens.
Refer to Table columns in the data mining reports to overview and define the data mining report table columns.
Adhese will only retrieve basic information if nothing is returned to the browser in response to a request to serve an ad. Consequently, some table cells in the reports will display an empty value.
To customise the header background colour of Excel reports, contact Support.
Revenue report
Adhese billing
You can create an invoice report for each month. This report provides insight into the number of impressions and clicks for each publication and priority combination.
To create an Adhese billing revenue report:
- Click Datamine in the left navigation menu. The Datamine screen opens.
- Click Adhese billing.
- In the Period field, select one or more months from the list and click the Save button.
- Click the Download as Excel file button.
There are several priorities or invoice types, like paying or inhouse. Therefore, the same publication can appear multiple times in the list, depending on the different priority types employed per publication. The Invoice type column can also have the value empty. Unfortunately, an empty request is one for which there were no booked positions at the time; so, no ad was delivered.
The last row of the Adhese billing report shows the number of erroneous requests. Erroneous requests are ad requests for which no corresponding position (i.e., the combination of a location and a format) exists in Adhese. In most cases, the location in question does not exist within the Adhese database. To create a missing location, click here. It is also possible that the client has changed the location URL structure, which affects how the page is recognised.
Per publication
The revenue report per publication contains the total reports for each selected publication within the selected month(s). If a booking ran on the selected publication and began or ended outside the selected period, only impressions and clicks served within the specified period will be included in the report.
To create a Per publication revenue report:
- Click Datamine in the left navigation menu. The Datamine screen opens.
- Click Per publication.
- In the Period field, select one or more months from the list and click the Save button.
- In the Publication field, select one or more publications from the list and click the Save button.
- Click the Download as Excel file button.
This report contains information about the number of impressions and clicks for each combination of a selected publication and invoice type (invoice type is the same as the priority of a campaign).
Bookings running on a channel of positions spanning more than one publication are attributed to each specific publication for its taken share.
Per position
The revenue report per position contains essential performance figures, such as click-through rate (CTR) and revenue, for each position on the selected publication(s) and within the selected month(s). This means that if a booking was made on the selected publication and began before the end of the selected month or ended after the start of the first month chosen, its impressions and clicks served in the selected period will be included in the report.
To create a Per position revenue report:
- Click Datamine in the left navigation menu. The Datamine screen opens.
- Click Per position.
- In the Period field, select one or more months from the list and click the Save button.
- In the Publication field, select one or more publications from the list and click the Save button.
- Click the Download as Excel file button.
Bookings that run on a channel of positions spanning more than one publication are attributed to each specific publication for its taken share.
Per campaign
The revenue report per campaign contains booking reports for each selected publication within the selected month(s). This means that when a booking ran on the selected publication and started before the end of the selected months or ended after the start of the first selected month, its booking data and reached impressions and clicks served in the selected period are included in the report. Bookings spanning multiple months are reported per month.
To create a Per campaign revenue report:
- Click Datamine in the left navigation menu. This opens the Datamine screen.
- Click Per campaign.
- In the Period field, select one or more months from the list and click the Save button.
- In the Publication field, select one or more publications from the list and click the Save button.
- Click the Download as Excel file button.
This report displays the same variables and metrics as the previous report, the revenue report per position.
Per month
This report shows the number of daily visitors, daily impressions, and daily clicks for each creative and position of the selected publications.
To create a revenue report Per month:
- Click Datamine in the left navigation menu. This opens the Datamine screen.
- Click Per month.
- In the Period field, select one or more months from the list and click the Save button.
- In the Publication field, select one or more publications from the list and click the Save button.
- Click the Download as Excel file button.
General revenue report
This general report provides a general overview of essential performance figures per device type for each booked position of a campaign.
To create a general revenue report:
- Click Datamine in the left navigation menu. This opens the Datamine screen.
- Click general.
- Click the Date range field. This opens a calendar. Select a start and end date.
- In the Publication field, select one or more publications from the list and click the Save button.
- Click the Download as Excel file button.
Inventory report
Monthly inventory
This report shows the number of unique visitors, available impressions, reached impressions, and clicks for each format of the selected publication(s) and the selected month(s). The number of impressions, contacts, and clicks is also distributed separately according to the priority (for example, paying, exchange, or inhouse).
To create a Monthly inventory report:
- Click Datamine in the left navigation menu. This opens the Datamine screen.
- Click Monthly inventory.
- In the Publication field, select one or more publications from the list and click the Save button.
- Choose a month from the Period drop-down.
- Tick the box to include channels in the report.
- Click the Download as Excel file button.
This report enables you to calculate a position's fill rate, the percentage of its sold volume. Do not tick the Include channels in the report box when creating the report. To calculate the fill rate, divide the number of sold impressions (column X) by the position's volume (column F).
Monthly inventory per country
The Monthly inventory per country report divides the number of monthly impressions by the selected countries and aggregates the non-selected countries' impressions. The report also shows the average daily contacts for the specified period.
To create a Monthly inventory per country report:
- Click Datamine in the left navigation menu. This opens the Datamine screen.
- Click Monthly inventory per country.
- In the Publication field, select one or more publications from the list and click the Save button.
- Choose a month from the Period drop-down.
- Tick the box to include channels in the report.
- Select or search for one or more countries from the drop-down and click the Save button.
- Click the Download as Excel file button.
Daily inventory
This report details the number of daily impressions and contacts for the selected month(s) and each format in the selected publication.
To create a Daily inventory report:
- Click Datamine in the left navigation menu. This opens the Datamine screen.
- Click Daily inventory.
- In the Period field, select one or more months from the list and click the Save button.
- In the Publication field, select one or more publications from the list and click the Save button.
- Click the Download as Excel file button.
Benchmark reports
Sometimes, it is not possible to track clicks from third-party creatives. Therefore, these third-party creatives are not considered when creating the datamine benchmarking reports.
Per publication
This report shows the overall average CTR per contact and impression for the selected formats and publications. It also displays the number of impressions, contacts, and clicks.
To create a Per publication CTR benchmark report:
- Click Datamine in the left navigation menu. This opens the Datamine screen.
- Click Per publication.
- In the Publication field, select one or more publications from the list and click the Save button.
- In the Format field, select one or more Formats from the list and click the Save button.
- Click the Download as Excel file button.
Per location
This report shows the average CTR per contact and impression for the selected formats and all selected publications' locations.
To create a Per location CTR benchmark report:
- Click Datamine in the left navigation menu. This opens the Datamine screen.
- Click Per location.
- In the Publication field, select one or more publications from the list and click the Save button.
- In the Format field, select one or more Formats from the list and click the Save button.
- Click the Download as Excel file button.
General reports
Per creative per day
This report renders daily performance figures for each creative in the selected period.
To create a Per creative per day general report:
- Click Datamine in the left navigation menu. This opens the Datamine screen.
- Click Per creative per day.
- Click the Date range field. This opens a calendar. Select a start and end date.
- Click the Download as Excel file button.
The number of impressions delivered is reported for each position. Positions that did not have any impressions delivered are not included in the report, even if they were booked on one of the selected dates.
There are no channels in this report; only the individual positions of a channel are reported.
If the amount of generated lines exceeds the standard limit of a spreadsheet, the report is cut off at that limit, and the filename is appended by .partial.
Distribution per publisher
The Distribution per publisher report provides a comprehensive overview of campaign performance by publisher, showcasing delivery metrics for each campaign between the specified start and end date. The report includes the most important figures for each booking.
To create a Distribution per publisher report:
- Click Datamine in the left navigation menu. This opens the Datamine screen.
- Click Distribution per publisher.
- Click the Date range field. This opens a calendar. Select a start and end date.
- Click the Download as Excel file button.
The Distribution per publisher report differentiates between the details of a booked position and that of a delivered position. This information is useful when a campaign is booked on a channel. The report indicates the precise location where the campaign was delivered.
Viewability report
The Viewability report shows the impressions and contacts per event and action for a given date range.
To create a Viewability report:
- Click Datamine in the left navigation menu. This opens the Datamine screen.
- Click Viewability report.
- Click the Date range field. This opens a calendar. Select a start and end date.
- Select one or more publications
- Click the Download as Excel file button.
Action report
The Action report shows the impressions and contacts per event and action for a given date range.
To create an Action report:
- Click Datamine in the left navigation menu. This opens the Datamine screen.
- Click Action report.
- Click the Date range field. This opens a calendar. Select a start and end date.
- Select one or more publications
- Click the Download as Excel file button.
Create custom reports with Excel PivotTables
This chapter outlines a basic road map for creating custom Excel reports, as the data mining reports can be used to create custom reports and charts in Excel.
We will use the per creative per day report as an example throughout the chapter. It is essential to read this chapter in its entirety, as the various exercises follow each other.
Create a basic report spreadsheet
To create a basic spreadsheet for the Per creative per day report:
- Click Datamine in the left navigation menu. The Datamine screen opens.
- In the menu, under General reports, click Per creative per day.
- Click the From field, a small calendar opens.
- First, select the first date of the period you wish to create a report for.
- Select the last date of the period you wish to create a report for.
- Click the Download as excel-file button to generate and download the Per creative per day report.
- Open the file in Microsoft Excel. The spreadsheet lists the daily number of contacts, impressions, and clicks and the daily click-through rate for all bookings a creative is combined with.
Create a pivot table
A pivot table summarizes data and reveals patterns and trends.
To create a pivot table:
- Click any cell that contains text or numbers.
- Click the PivotTable button in Excel.
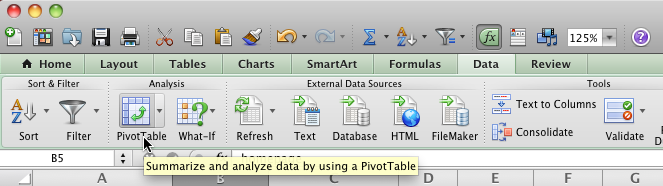
- Depending on your Excel version, a dialogue window may ask you to confirm which data you want to analyze and where you want to place the pivot table. If you see the Create PivotTable dialogue, click OK to confirm the default values.
- Excel creates a pivot table based on all data in the current worksheet and places it in a new worksheet. Depending on the Excel version, your new pivot table may be empty or filled with default parameters.

Change the content of a pivot table
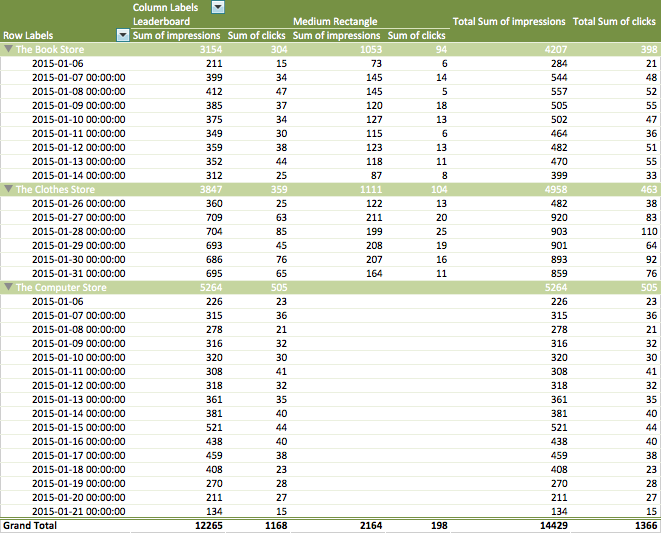
The pivot table we are going to recreate is quite basic. It shows you the daily number of impressions and clicks for each type of format.
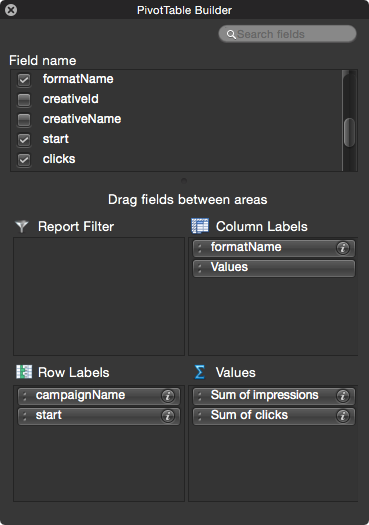
To recreate the above pivot table, we need to change it by dragging items between the Row Labels, Column Labels, and Values areas in the PivotTable Builder.
To change the pivot table:
-
Go to the PivotTable builder.
-
Select the following variables in the Field name section:
- campaignName,
- formatName,
- start,
- clicks,
- impressions.
-
Drag the campaignName and start variable in the Row Labels area. Put the start variable under the campaignName variable.
-
Drag the formatName variable to the Column Labels area.
-
Drag the clicks and impressions variable to the Values area.
Add new variables or drag variables from area to area to get acquainted with pivot tables' intricacies. The content of the pivot table will change according to the adjustments in the PivotTable Builder.

Other uses of a pivot table
Data mining reports allow you to produce more than pivot tables alone. For example, you can use the pivot table's data to plot graphs or make comparisons.
Plot a graph
We will graph the evolution of a campaign's daily impressions for the leaderboard and medium rectangle format.
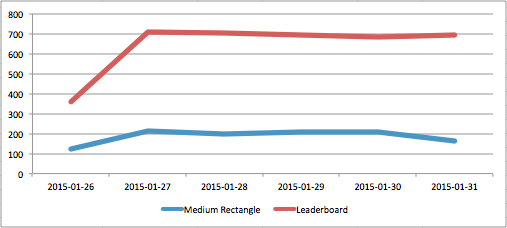
To get the above graph, create a pivot table first (see Create a PivotTable and Change the content of a PivotTable).
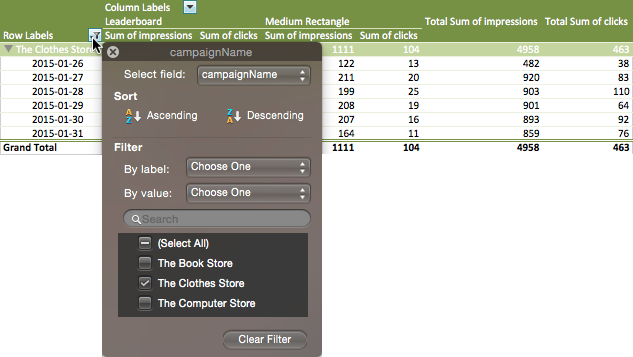
To restrict the report to an individual campaign, click the filter icon next to Row Labels and deselect the campaigns you do not want to see in the report.
Then, select the values from the Sum of impressions columns and insert a chart.
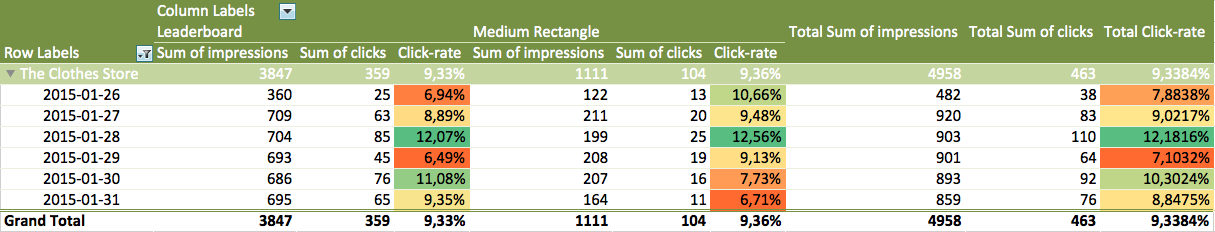
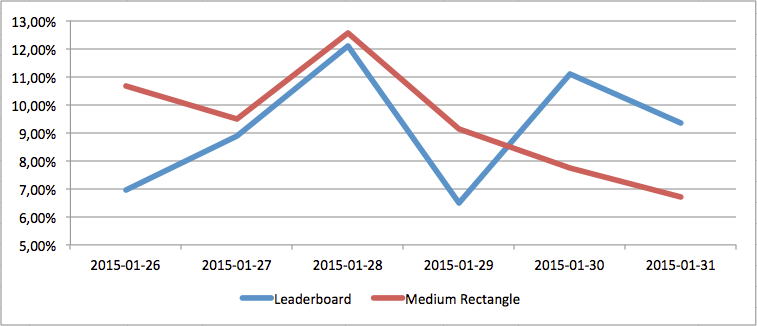
Compare the daily click-through rate of formats
To compare the click-through rates for the various formats of a campaign:
- Add a calculated field to the pivot table. Go to the Insert menu and click Calculated Field …. The Insert Calculated Field dialogue window opens.
- Provide a name in the Name field, for example, Click-rate.
- Insert the formula in the Formula field.
- Click the Add button to save the calculated field.
- Click the Ok button.
- To add the newly created calculated field to the pivot table, drag the Click-rate variable to the PivotTable Builder's Values section.
- Select the values and
-
Add a conditional formatting rule (Format > Conditional Formatting …) to highlight high and low values in the pivot table, and/or
-
Plot a chart to visualize the comparison.
-


No comments to display
No comments to display